Understanding D3 Selection Operations
As you might have heard, we’ve been working on a few new things around here, including new ways of visualizing data. One of the new libraries we’ve pulled in to help out is D3.
If you’re not already familiar with D3, it’s library designed to help transform DOM elements in response to data sets. Although D3 is frequently used with SVG elements (as we are using it at Harvest) it’s not specifically required to use SVG.
Sometimes when working with D3 especially in the context of animating graph elements, we’ve discovered that the DOM elements don’t quite do what’s expected. I had an epiphany moment the other day when trying to understand how D3 selects DOM elements and compares them with the data set — hopefully this post can help you out if you’re stuck in the same rut that I was!
The Epiphany
There are two critically important things I missed when I thought I knew how D3 selections work:
- D3 stores the data object which is responsible for creating a DOM node on the DOM node itself.
- You can control the method by which D3 compares your data objects with those stored on DOM nodes to determine if they are the same.
Each time your graph is drawn, you can think of D3 as grouping the required actions into three segments on a Venn diagram:
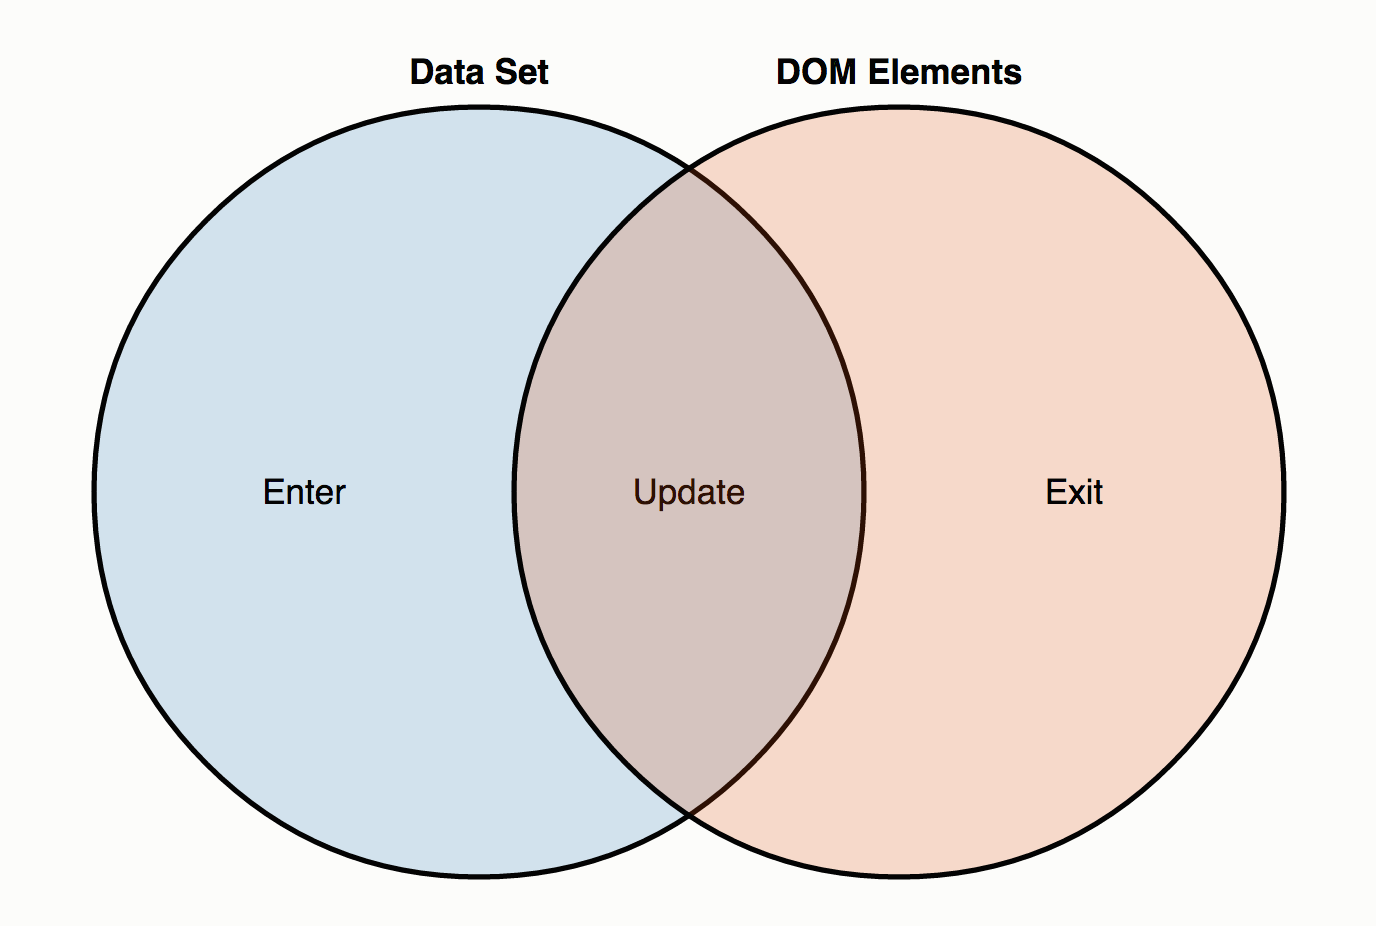
- Remember, D3 stores the data object that created a DOM element on the element itself. If that data object is no longer present in the data set, it’s considered an “exit”.
- If a data object exists both in the data set and as a property of a DOM node in the selection, it’s considered an “update”.
- If the data object has no DOM element in the selection, then it’s considered an “enter”.
Any operation called within the context of the selection.enter() or selection.exit() functions will be executed only during those phases:
var dataset = [{ value: 35 }, { value: 13 }];
var lines = d3.select("body").append("svg").selectAll("line").data(dataset);
var yValue = function (d) { return d.value; };

lines
  .enter()
    .append("line")
    .style("stroke", "black")
    .attr("x1", 0)
    .attr("x2", 100)
    .attr("y1", yValue)
    .attr("y2", yValue);

lines
  .exit()
    .remove();
Anything not within selection.enter() or selection.exit() is considered part of the “update” operation. The “update” operation is also called immediately after “enter”, and updates can easily be animated:
var dataset = [{ value: 35 }, { value: 13 }];
var lines = d3.select("body").append("svg").selectAll("line").data(dataset);
var yValue = function (d) { return d.value; };

lines
  .enter()
    .append("line")
    .style("stroke", "black")
    .attr("x1", 0)
    .attr("x2", 100)
    .attr("y1", 0)
    .attr("y2", 0); // start from zero (entrance animation)

lines
  .transition()
    .attr("y1", yValue)
    .attr("y2", yValue); // called immediately after enter(), and when value changes

lines
  .exit()
    .remove();
Controlling How Objects Are Compared
In order to successfully animate chart elements when data changes, it’s important to keep the relationship between the proper DOM nodes and items in your data set. By default, D3 uses the index of the data in the data array to compare the data set with DOM elements. This isn’t always ideal — but thankfully, you can pass a second (optional) parameter when assigning data to a selection (when calling the .data() function):
var dataset = [{ id: 2553, value: 35 }, { id: 2554, value: 13 }];

var lines = d3.select("body").append("svg").selectAll("line")
  .data(dataset, function (d) { return d.id; });
One Last Thing…
The first time the chart is rendered, you shouldn’t feel strange about creating a selection which has no elements:
var lines = svg.selectAll("line"); // but no <line> elements exist yet!
Just think about it in terms of our diagram, and remember that if the DOM element doesn’t exist yet, you’ll get a chance to create it during selection.enter().
Happy charting!
If you’re looking for further reading on selections, you should consider reading How Selections Work, Object Constancy, and Thinking with Joins (where the Venn Diagram for this article (adapted) was taken from).